mercredi 11 novembre 2020

Sensation Firewall

There is at least one long-standing theme in my thinking about social change. Usually people like to assign responsibility for social patterns. We give ownership of responsibility for the Department of Education to one person. Then when things go wrong, we know who to blame. If they themselves can isolate the blame to one person under them, they fire the person and everyone moves on.

I'm not saying this paradigm never works. It often works. It's a component of meritocracy. But there is an interesting, permanent shortfall. By focusing on individuals, we keep overlooking the systems.

To some extent, holding one person to account for a system failure is a way to appease anger without making the larger concessions of fixing the system.

Hate is a normal enough human emotion which I define as "anger + disgust, justified or rationalized so it gets stuck." To my knowledge everyone has the first experience, anger + disgust; the second step, applying reason to cling to it, is optional. For me, it's also inadvisable - it's misery and seems to cloud judgment.

So yes, we choose and we are responsible. Leaders take that on more than most. Existentialism gives a great, simple answer here: whatever you do, that's what you did. You're fooling yourself to think otherwise. It's the one aspect of morality that is up for no debate at all.

Let's get back to social change. It's social. And it's change.

For that, I suggest "anger + disgust" is normal and often drives constructive awareness and action. But that is not healthy as a permanent condition, and I think we do have choice in it. And while I don't think we should command each other how to feel, it is totally fine to share how we feel, and make suggestions. My policy? In the end, for clarity and humanity if possible, hate the game, not the player. And then don't even hate the game. Go and fix it. Or at least suggest ways it can be fixed, and talk about ways it can be fixed.

We don't do this enough. We assume the key systems can't be altered. I don't understand why... except that I think we are a little too preoccupied with the model of one individual owning an institution's responsibility.

mercredi 28 octobre 2020

A Recipe for Overtaking the Number Two

So here's an idea I don't have good words for, but it keeps cropping up. Imagine we're in Congress and a recently drafted bill is in revision. Let's say it's about transportation. That affects everyone almost equally, in the sense that we all absolutely need it for food and other supplies.

We can probably safely predict that Republicans and Democrats agree that there are transportation problems to solve, and that they're important. There's a call for bipartisan support for a bipartisan bill. That seems rational to most.

Also, we can probably also predict that Democrats are proposing more spending, and Republicans are proposing less spending, or even cutting existing expenditures. There's a stereotype of fiscally responsible conservatives and fiscally wasteful liberals. If history supplies evidence of that, it's certainly very mixed at best. For example, in recent times, Democratic control seems correlated with more robust fiscal decision-making, prosperity, and even balancing the budget. No doubt Republicans can point to evidence that says the opposite. I don't claim to know for sure.

These ins and outs are not my wheelhouse. But I think there's enough evidence for someone out there to have extracted more or less the right answer, whatever it is.

My point is not about which way that goes. But for the sake of illustration, let's say Democrats want to tax gasoline more and build high-speed rail lines and add bus routes, and Republicans want to allow more tollbooths and expand existing highways and set aside HOV lanes for the environmentalists. Both sides say they are trying to use what's there, expand throughput, and reduce emissions, while keeping a close eye on the budget.

Because Democrats expect Republicans to shoot down new spending, they go big on the proposals. Compromise comes later. They'll argue for exactly what they want up front, and make it sound more self-evident than the sun in the sky, except that it isn't going far enough. Republicans will be waiting for this by assembling a number of arguments for shooting it all down.

Maybe we could call this an arms race. That seems too vague. I don't have a good, more specific name for it. But here's a great cartoon of Microsoft when it had entrenchment problems. (Entrenchment, hedging, arms races, negotiation bids, and polarization all describe what I'm talking about, but no phrase with the precision I would like as to what, why, and how: the idea of taking specific opposition as a hidden assumption and the distortion that creates.)

You've probably seen it before. Critical detail: the imagined guns inside the bubbles, to which the actual guns are a response.

My point is that Democrats end up defining themselves as not-Republicans, and Republicans as not-Democrats. Any time any of them says anything, it has to be taken in the context of what they are not. Democrats often do not speak from the origin, but in response to what was just said. Not "gun laws need improvement" but "guns are slaughtering our children by the thousand." The same with Republicans. Because they can rely on their opposition to be there, and rely on encountering resistance, they get used to pushing harder. They go X amount one way, and the other side pulls them Y amount back. So a back-of-the-napkin calculation shows that any time they want to go X far, they have to push for X + Y. If they believe anything a bit, they suddenly have to believe in it absolutely, or it counts for nothing - or, worse, less than nothing, because people are weird about transparent uncertainty.

This leads to extreme or at least entrenched attitudes. Everything they say is within this tug-o-war context. It can't be taken at face value.

Yet it often is, even by them.

And we watch it and get involved and start to mirror this.

This business in Congress is not the only reason for polarization; we don't need a legislative body for that. There is something called Heider balance in social psychology that shows, in math, the basic reason for and mechanism of polarization. It isn't complicated. But the Congress image is one clear example of it: the common enemy. The enemy of my enemy is my friend. The friend of my enemy is my enemy. The idea is in the Bible, but it lives deeper in the mind than recorded history, in instinct. People fall in with the party line so they aren't taken for the enemy. That's why polarization happens. It's a mathematical consequence when you apply those rules to a network. You get two camps. If things are tense enough, a war breaks out between the two camps. It's happened a million times - maybe a trillion throughout human and primate evolution. Maybe more.

But if we know that, we can alter it, maybe even adjust for it completely.

The point is we understand how it happens.

The better you understand a problem and its context, the closer you are to fixing it.

Here is my ultra-simple prescription:

1) There are MORE THAN two sides to every story.

2) Curiosity

samedi 24 octobre 2020

Is Your Brain a Matrix?

"Artificial networks are the most promising current models for understanding the brain."

Skepticism on that point has been popular for a long time. Skepticism is good. But your brain has a lot in common with a giant matrix. Your senses are like a giant vector (the data in your favorite song), and your thoughts and actions another giant vector (a synth recording of you covering that song, capturing your input to the instrument), with your brain a matrix that converts one to the other. How far does the similarity go? Unknown... a giant matrix can approximate any process as closely as you want, if it's big enough and has enough time/examples to learn.

If all that - a giant matrix as a brain - seems too simple to be possible, keep in mind that this kind of matrix represents an interacting network. There's a math proof that a matrix can approximate any process, meaning any natural or computational process as far as we understand the word "process," and it's very closely related to the way you can break any sound down into a spectrum of frequencies. The proof actually depends on the same idea.

The "deep" in "deep learning" just means using a bigger matrix. Often that means using fancier hardware to run the learning faster, but not necessarily. This is very similar to cameras and screens with higher and higher resolutions. A newer phone should have a faster chip to keep up with a higher pixel count in camera and screen. But it doesn't technically need a faster chip. It would just slow down otherwise. Images didn't get more complicated, only bigger.

But for that ability to sculpt a matrix into any process to really work, the matrix needs to be broken up into individual vectors, and those are run against the input - the vector representing senses - one at a time, with each result - a work-in-progress vector - put on a curve a bit like a grading curve. This curved result is then sent to interact with the next vector that was broken off the matrix. Rinse and repeat!

Eventually that work-in-progress vector is done, at which point it represents the thoughts/actions that are the output. Think of each number in the vector as the strength of each dimension of possible response, the probability of hitting each note on a piano, or how much to move each muscle, etc. So to put the last paragraph in different words, a "deep learning" matrix, aka neural network, is no more than a bunch of multiplications in the form of dot products between pairs of vectors, with a little filter/curve after each one.

Incidentally, each one of those vectors broken off the matrix can be visualized as a line or edge. You can imagine that you could draw any picture, even a 3D one, even a 5005D one, with enough lines or edges. You can make it as clean and accurate as you want by adding more lines. We know that intuitively, because that's how sketching works. Deep learning is not unlike sketching very fast. Similarly, you can draw a very smooth circle, as smooth as you want, with enough little square pixels. See it? Now we can do that with concepts.

But those are details. Students who think matrix math is boring will typically hear about AI from me, haha. And they do tend to find it interesting.

The curve, or conditioning, after each step is what makes this different from just multiplying a giant vector by a giant matrix to get another giant vector. That would be too simple, and it's kind of the lie I told at the start. Instead, information flows step by step through the layers of the matrix much like energy filtering up through the layers of an ecosystem, towards apex predators and decomposers. And there's that curve/filter between each level. I suppose it's a bit like a goat eating grass which is converted into goat; something changes in the middle. It isn't grass to grass, it's grass to goat, so there's a left turn in there somewhere. That bend is critical but not complicated at all, though why it's critical is more difficult and I don't fully understand why. That filter doesn't even have to be a curve, it can just mean putting a kink in each line - just a bend in each vector, like a knee or elbow. It almost doesn't matter what the bend is, just that it's there. That's surprisingly essential to the universality of neural networks, so apparently it adds a lot for very little. I don't have a good analogy for why that's true, except that the world isn't actually made up of a bunch of straight lines. It's more like a bunch of curves and surfaces and volumes and energy and particles and static and other noise and signals between interconnected systems, and this step, putting kinks in the lines, allows the processing to break out into a much larger possibility space.

Theoretically, the old possibility space (without bends) was the stuff that you could accomplish with the "transformations" you learned in geometry - stretches, rotations, reflections, glides. The new space is all possibility space - or any "before/after" that can be measured and processed as a measurement. Artificially aging your neighbor's cat, painting today's sunset from weather data... If there's any logical connection between input and output, between before and after if there's time involved - even if that connection is just the laws of physics - or even if it's just a random association to memorize, like didn't you know volcanoes and lemons are connected because I said so - that connection can be represented by a big enough matrix.

So instead of pixels, it's lines, and instead of lines, it's bends. Think of bends as moments of change. Maybe this is a little like adding 3D glasses and color to a greyscale picture without altering the resolution. But... the effect of the curving/filtering/bending I've been talking about would be far more shocking than the image upgrade if you could directly experience the difference, given that we get the potential of learning and mimicking every known process. Maybe we do directly experience that difference as a key component of being alive. It's more like adding motion to that image, and an understanding of where the motion comes from and where it's going. Or to rephrase, the greyscale picture with our "kinks" update is now more like a mind than a photo - which, after all, is a simpler kind of matrix, one that is not a network.

The other simplification I made is that the big matrix is actually broken down into multiple matrices first, before those are broken down into individual vectors, each of which is roughly equivalent to a single neuron. What I described was a single-file chain of neurons, but there can be many neurons next to each other. Each layer of neurons in a neural network is its own matrix. Each neuron is its own vector. But I'd say that aspect of the layers is the least important detail here, other than realizing you can see each row of a matrix as a brain cell, which is neat. And you can very roughly imagine each brain cell as knowing how to draw one line-with-bend through concept space and give its vote on that basis.

We have 6 layers of neurons in the cerebral cortex, for reference, so at a gross simplification that would be 6 big matrices in a chain, with the rows of each matrix representing individual neurons.

samedi 19 septembre 2020

How to Unroll Convolutions

In my last post I showed how you can get a bell curve starting with any real number, in only three tiny steps.

This time I want to get a bit more practical, or at least hands-on. You've heard of a bell curve (or normal distribution, Gaussian, etc). Not only that, but you've been put on bell curves at various times, and inspected many other bells to understand aspects of the world. We all know this is a basic measurement and a shape that shows up, well, all over the show.

Why?

I want to explain that simply.

Briefly, a bell curve describes a sum of random influences. Height is normally distributed (in other words on a bell curve) because many little random-ish factors (genes, nutrition, etc) combine to produce your total height—and everyone else's, for that matter, and the same would go for any species. If you're an alien, chances are strong that height for your kind is normally distributed, not to mention many other measurements.

But let's start simple. Let's roll the ol' die.

(Wikimedia Commons)


We got 4. But we could have gotten 1, 2, 3, 4, 5, or 6. I'm assuming you thought of a 6-sided die first, and that's what we're using. (By the way, that die is from ancient Rome, so it actually is "ol'.")

(Academo.org)

Here's what things would look like over many rolls: 6 equally likely outcomes. If we kept a tally, it would look lopsided at first, but we wouldn't expect any of the 6 numbers to pull ahead and stay ahead. (See above.) Actually, the longer we kept a tally, the more the race would be neck-and-neck. (That's what the law of large numbers says. See below.)

(Academo.org)

(Xactly.com)

What if we roll 2 dice, though?

(Unknown Source)

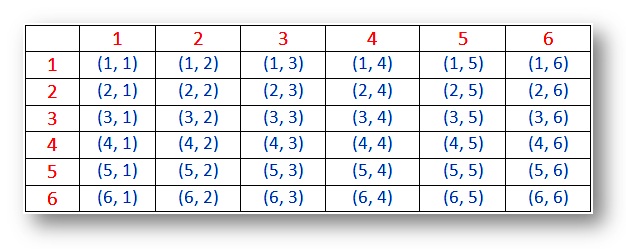
At first, we're going to ignore the green and pink. There are 36 total outcomes (6*6=36) arranged above. As with the single rolls previous, all of these 36 rolls are equally likely. That's important, so I'll say it again: every square (representing a pair of rolled dice) in the chart is equally likely. Here's a chart that makes them look the same.

(Math-Only-Math.com)

(Just a heads-up, between here and the pictures of black dominoes below, we're taking an illustrative detour that you can skip and come back to later. It helps with filling in and seeing the whole picture from end to end.)

Ready? If we go deeper with two dice, the landscape changes. First, notice we could tell the difference between the dice before, as if each had its own size, color, and personality. This was indicated by the dice on the left, which are really just different faces of one die (call it "Left"), and the dice along the top, which are just faces of the other die (call it "Top"). We know which is which. When we roll both dice, the "Left" number is shown on the left between parentheses, like an x-coordinate, and the "Top" number is shown on the right, like a y-coordinate. If we can tell them apart, there are 36 outcomes. But if we can't, only 21 outcomes appear.

Ok. We shall now require our experienced roller of dice to treat all colors as equal. Just to be clear, in this color-equal scenario, rolling 2 and 4 will be the same as rolling 4 and 2. That combination is different from 1 and 5 (which is the same as 5 and 1). Even though all four pairings add up to 6, we'd count two distinct combinations, which I'll call 2&4 and 1&5.

Notice that when both dice come out the same, there's only one way it could have happened. In the chart above, there's (1, 3) and (3, 1), which are the same combination. But there's only (3, 3) once, (4, 4) once, (5, 5) once, etc. So you're twice as likely to get the combination 3&1 as you are to get 3&3.

Let's recap. If we only care about the actual numbers on the dice, meaning we don't care about the colors of the dice, or which die is to the left and which is to the right, etc, then we no longer have outcomes that are all equally likely. This is an artifact of combining two dice which can be mistaken for each other, or at least which are allowed to work exactly the same: there is no priority, rank, order, favorite, etc. One die is as good as another—it doesn't matter which has the 2 and which has the 3. I'm belaboring the point because an interesting transition has happened.

As mentioned earlier, there are 21 of these results that are no longer equally common. The calculation that leads to 21 is technically a combination with replacement (specifically, "6-combinations-of-2 with replacement," the 6 because of 6 sides, the 2 because of 2 dice, and with replacement because both dice are always put back, so they can start out the same from roll to roll).

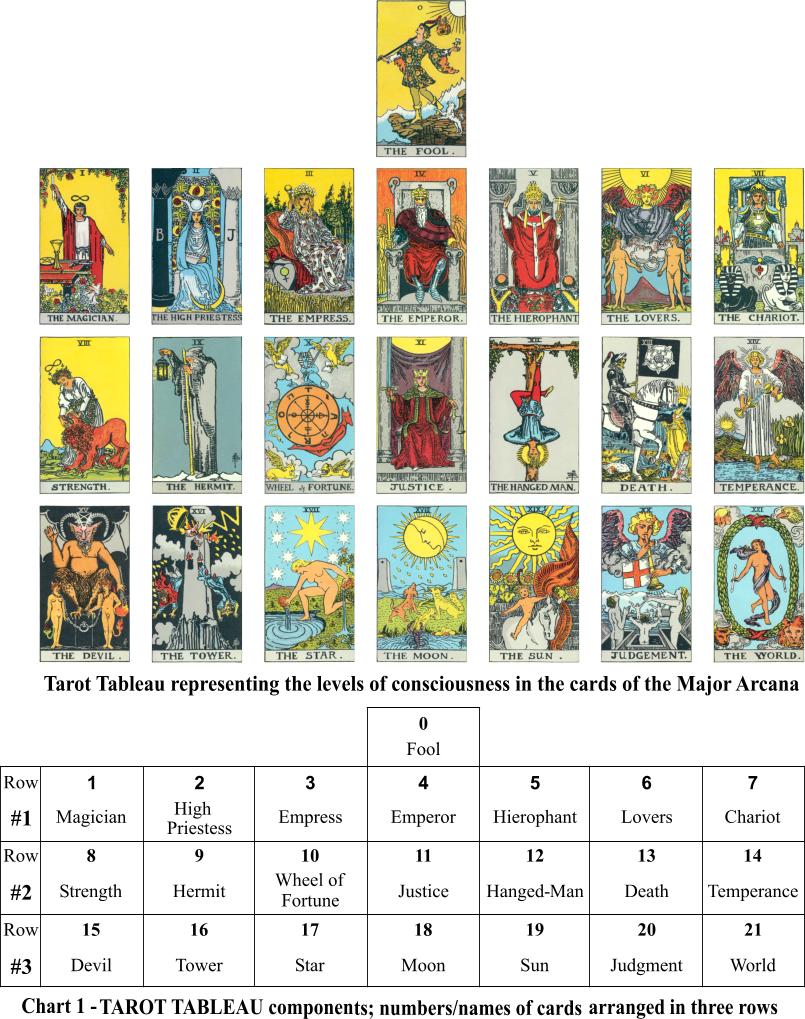
This way of counting does show up materially. It shows up in nature. And it shows up in games, which, after all, are the birthplace of probability and statistical theory (traceable to a letter exchange between Blaise Pascal and a gambler who asked for his help). For example, dominoes began a millennium ago as frozen die rolls for two dice, and they soon evolved into playing cards. The normal 52-card deck has come to reflect 52 weeks in a year. But tarot cards preserve their origins. A deck of tarot cards has 21 trumps, a zero card, and 56 pip/court cards. 6-combinations-of-2 is 21, and 6-combinations-of-3 is 56. So a tarot deck can be seen as a group of cards representing all the rolls of 2 dice, another group representing all the rolls of 3 dice, and then a 0 that's a wild card.

Here are 21 trumps and the 0, for good measure. Bet you never thought of them as dominoes before. (Try to pretend it doesn't talk about "levels of consciousness.")

(Triple 7 Center)

The original Chinese domino sets have 21 types of dominoes for precisely this reason. Meanwhile, traditional European dominoes come in sets of 28 and include 0 as a possible "roll" for each die, so a full set would correspond to all the frozen rolls of a pair of 7-sided dice. True to form, 7-combinations-of-2 is indeed 28. But let's set these aside. The rolls of 0 bring somewhat more confusion than the lone 0 card in tarot. The takeaway is that cards, dominoes, and dice are closely related, and they're all excellent mental tools for thinking about probability and statistics.

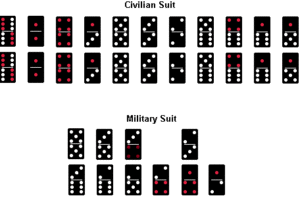
In the image below, the upper group of Chinese dominoes is doubled up (two of each kind), while the lower group is made of singletons. We can ignore the decorative colors. There are 32 dominoes in all, but you'll see 21 types. (Specifically, there are 11 different civilian dominoes, and remember that number 11, because it comes up in a second. And there are 10 different military dominoes.) The doubling up doesn't follow the same logic as I talked about above—things get shuffled around a bit—but a glance shows that some pairings (patterns from the civilian suit, for example 1&3) are twice as common/likely as others (patterns from the military suit, for example 2&4).

(LearnPlayWin.net)

Curiously, they even have names. Here are just the 21 Chinese domino types. Again, these embody all the rolls of two dice if you don't care which die is which. Hey, bet you didn't see ancient names like "Copper Hammer Six" on your radar!

(Amazon)

That was a bit of a detour just to reflect on what happens when two dice act like identical twins with the same name: almost counter-intuitively, equally likely faces of a cube give way to unequally likely patterns of pairing. Structure emerges. Possibilities begin to pile up here and not there. Multiple paths lead to the same result. The change is relevant to the creation of a bell curve.

Let's get to the really interesting part. When you add the dice, there will only be 11 possible sums. These are the numbers in the squares in the first chart, which I'll bring back to make things easier.

(Unknown Source)

The sums will go from 2 (ie, 1+1) up to 12 (ie, 6+6), which means there are 11 of them. (If you took the excursion above, remember when I said 11 would come up soon? Not too surprisingly, early on, 11 was the number of cards in a suit. The chain goes: 11 distinct sums with a pair of dice, 11 dominoes in the doubled up civilian suit, 11 cards in the early card suits. It's cultural evolution!) Our transition by the route of adding is important, too: we've gone from 36 outcomes, total, and those are equally likely (called "microstates"), to 11 after adding the faces of the dice, and those sums are not equally likely (called "macrostates" because they can include many microstates). If you look at the grid above, you'll see that 7 occurs more often than 10 as a sum. There are more ways to get to it. So if you ever have a chance to bet on the sum of two dice, bet on 7 and you'll win more often than anyone choosing other bets. As it so happens, 7 is the mean, median, and mode, and it's six times more likely than 2 or 12.

To use the terminology just introduced, 7 and 10 are two different macrostates. The macrostate of 10 covers only 3 microstates, but the macrostate of 7 covers 6 microstates. I like to avoid jargon, but these three levels of thinking about a pair of dice (36 equal microstates/permutations-with-replacement, 21 unequal macrostates/combinations-with-replacement, and 11 unequal macrostates/sums) can be confusing to think about. It really helps to have some words. You can pick whichever you like.

(Xactly.com)

Here is what the outcomes would look like over many rolls. Above is an experiment and below is the idealized, long-term version. Macrostates line the horizonal axis. Each black-and-white pair below is a microstate. (Also, notice the similarity between this way of showing a pair of dice and a domino. Normal dominoes are macrostates of dice, but these ones are microstates, because all 36 permutations are included, and no symmetry is removed.)


(Unknown Source)

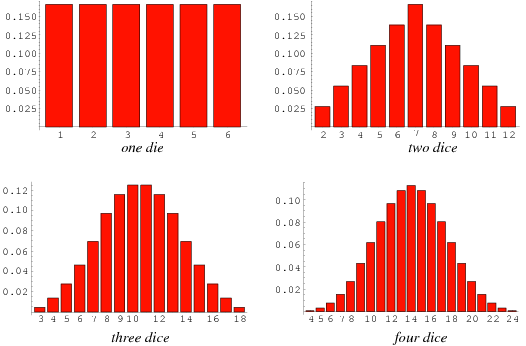
Long story short, the picture is no longer flat. It is not a uniform distribution anymore. Taking two die rolls and adding them does something a bit different from just rolling a die with 11 sides, or 21 sides. In fact, we've done something interesting that could look scary, something that involves calculus, but we don't need that right now. By rolling dice and plotting, we've done it. This is called the convolution of two random variables.

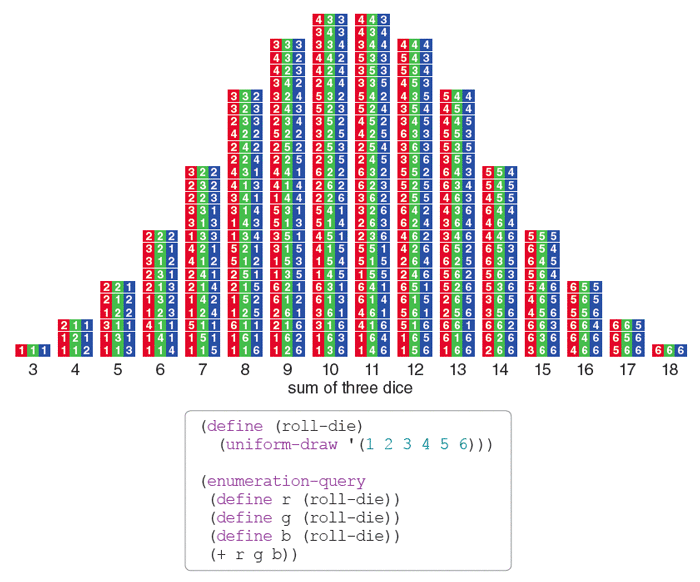
Let's convolve again. With one more die, we are convolving three dice together. What does that look like?

(American Scientist)

Note that the sums of 3 to 18 correspond to sums of 2 to 12 with two dice. (Meanwhile, and not shown, there are 56 clearly different combinations for three dice, corresponding to the 21 combinations for two dice discussed earlier; relatedly, there are 56 suit cards in a tarot deck, and 21 trump cards, not including the 0 card.) The chart above uses three colors, one for each die, to show how the triples of dice are ordered into all 6*6*6 = 216 permutations and sorted into sums—3 through 18.

Though the above (that code is Lisp by the way, but we're ignoring it) is not exactly a normal distribution as it's discrete and jagged, it already approximates one. The more dice you throw, the more the histogram will approximate a perfectly smooth bell curve.

(Wolfram MathWorld)

A bell curve is the result of convolving ("adding up") random influences.

The especially interesting thing about bell curves is that even if your dice were weighted for cheating, you'd still get a bell curve. Maybe it makes sense that many fair dice would produce that nice smooth shape, given enough dice. But unfair dice would, also. We'll say more about those dice in a second, but let's divert to the real world first.

When you're adding up the influence of genes and nutrients and so on to get a person's final height, it doesn't really matter how common the genes are compared to each other, for example. Some variants could be rare, others common. When you add up their influences, you'll still get a bell curve.

And how often do random factors add up to something? Very! That's why the shape is so common!

(Xactly.com)

It turns out that as long as the dice (random variables/factors) behave something like physical dice, then convolving enough of them will produce a bell curve. What dice would not be allowed to do is lack an average value and a standard deviation. If the die had infinitely many sides, for example, this wouldn't work.

As a consequence, when you see a bell curve, you can conclude that the main contributing factors, even if they're really quite random, all have well-defined averages and standard deviations. The random variables may or may not themselves look like bell curves when analyzed individually. They could be uniformly distributed (flat) like a single die. They could be noisily scattered within a band of possible values. Or the weighting could be anything else that has a finite, consistent average and standard deviation. Bell curves show up everywhere because when you add up randomness, it's very difficult to avoid them.

A More Normal Formula

You may not have realized quite how simple the normal curve is. The formula usually shown obscures it almost irresponsibly.

Take ex...


Square the x, and the function is now positive on the left side.


You get an extremely narrow parabola variant. Here's a parabola in green for comparison. (The next two images are just for illustration, not part of the process.)


(Technically, it's the exponential of a parabola. It's ex2 instead of x2. If you ask me, that counts as a parabola variant. But it grows much faster.)


Now negate the exponent.


Voila.


That's the rule. It's an upside-down parabola for an exponent.

The rest of the famed formula is tweaking—specifying the unit size via the mean (\(\mu\)) and the standard deviation (\(\sigma\)). It looks complicated, but this is a lot like describing a parabola with \( (y-k) = 4p(x-h)^2 \) instead of just \(x^2\). The second gives you the foundational idea, while the first incorporates adjustments.

\[\frac{1}{\sigma \sqrt{2\pi}} e^{-\frac{1}{2}(\frac{x-\mu}{\sigma})^2}\]

Great to have on hand as a reference, but we already have the essential bell curve just from two modifications to basic exponential growth. We square the exponent and then negate the exponent.

\[e^x \rightarrow e^{-x^2} \] Oh, and if the e is confusing, we could have started with any example of exponential growth. For example, we could use a base of 2. (A base multiplier of 2 sets a slightly slower growth rate than with e.) The picture would look much the same.

\[2^x \rightarrow 2^{-x^2} \]

This time I'll leave out the two graphs comparing with a basic parabola, because they weren't really part of the process anyway, and they look the same. And remember, there's nothing very special about 2 or e here. Any real number can be turned into a bell curve by exponentiating, squaring the exponent, and negating the exponent.

\[2 \rightarrow 2^x \rightarrow 2^{x^2} \rightarrow 2^{-x^2} \]

\[3 \rightarrow 3^x \rightarrow 3^{x^2} \rightarrow 3^{-x^2} \]

\[5.8316 \rightarrow 5.8316^x \rightarrow 5.8316^{x^2} \rightarrow 5.8316^{-x^2} \]

\[\pi \rightarrow \pi^x \rightarrow \pi^{x^2} \rightarrow \pi^{-x^2} \]

Below is with a base of 2.

mardi 15 septembre 2020

The First Rule of Presumptuousness

I've always felt that "know thy audience" becomes a form of stereotyping. Certainly, in this or that design you'll get to know, and meanwhile learn to incorporate, facts and measurements of a special group of people. An ATM should really work for everyone who might have a bank account. But there's a big difference between "usability" and "targeting an audience." Usability doesn't pander, it just makes accessible and comfortable. Audiences, though, are too often pandered to.

samedi 15 août 2020

How to Step Back to Go Forward

Debate is a game. It's something most people don't quite understand, or don't apply.

If you're in a disagreement and you don't want it to turn into a fight, you both need to move towards treating the discussion as a debate, which is a game. That can be difficult, especially for a big issue, but if you can't, it's best to put the discussion aside for now.

Let me bring in a pretty typical definition of game. A game is a finite contest with rules, an experience you can win or lose, but the consequences are negotiable.

Russian Roulette has rules: put one bullet in a revolver, spin the thing, point the gun at your head, and pull the trigger. If it was a live chamber, you're probably instantly dead, and you've lost. If it was a blissfully empty chamber, you've won. But see, the consequences are not negotiable: either you're dead or you're alive at the end. So while Russian Roulette resembles a game, it is not.

Debate, on the other hand, is a game.

Many people very understandably don't want a discussion to be just hot air—they want to get something done with it—and by driving at that purpose too hard, they lose the value of discussion.

The value of discussion is that it's virtual. The words are only words. Your debate is a little virtual world of words, where you're trying to follow the rules of logic and evidence—you want the debate to have bearing on actual life. Yet the consequences of the debate are very much negotiable. What does it mean to win or lose a debate? Maybe nothing. Maybe something. That's all TBD by the participants afterwards. Nothing is set in stone. And, as I said, that is the actual value of debate. If you had to move all the bricks physically into different arrangements while debating architectural choices, civilization would still be in the stone age today.

The virtuality of conversation, and debate, is its greatest strength. And then people go and forget that, or never quite understand it and its implications.

Some people understand debate is a game, whether they would use that word or not. And they are usually much more pleasant and engaging to discuss controversial topics with. This doesn't mean they have no beliefs or don't consider the topics important, or even critical. It's just that debate is a game. You don't solve global poverty in your chit-chat with your housemate over dinner. So stop acting like you do, and if you have a particularly good round of debate, you might actually be somewhere at the end that you weren't at the beginning.

That's how it works, and it really truly does work.


* Note: just because it's a game doesn't mean you have to be goofy, though that's often a very useful approach. Taking the pressure off allows people to speak more freely and think more creatively together. But you can also be very serious. Debate that's a game can still get heated, but it never gets personal. The feminist "everyone's perspective is valid" approach is also a great way to make a debate a game. Goofy, spirited but not personal, listening while perspective-taking—all of these are ways to make debate do its job, and they share the same principle. To the extent they would ever get a little intense or combative, everyone understands that this is sparring, and nothing to do with liking or disliking each other. May the best idea win.

** The definition of game and the Russian Roulette example I'm pretty sure both come from the book Half-Real. My copy went to a good friend 6 years ago before I went into a big surgery I thought I might not survive (statistically, there was a 1% chance I wouldn't, which makes a very big and relatively safe revolver for Russian Roulette, but that's a smaller revolver than for most surgeries, and it was a 5 hour procedure that left me with 55 staples and now a 13-inch scar, so maybe I wasn't being that dramatic). I hadn't finished reading it, but it has the best definition of game I've ever seen anywhere, by a long shot. Most books on game studies start out defining game (yawn). This one, though, makes that triply worth your while to read.